Page 74 - Final Atlas
P. 74

Section-4 - City Profiles   |   Punjab Cities Growth Atlas
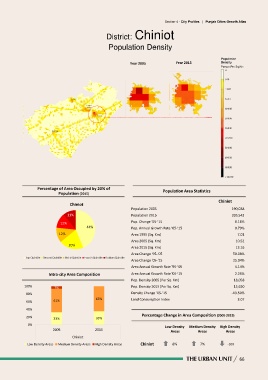

                                                                    District: Chiniot


                                                                     Population Density


                                                                                   Year 2005                    Year 2015


                         Percentage of Area Occupied by 20% of
                                                                                                       Population Area Statistics
                                      Population (2015)

                                                                                                                                          Chiniot
                                             Chiniot
                                                                                    Population 2005                                                190,038

                                           11%                                      Population 2015                                                205,543
                                                                                    Pop. Change ‘05-’15                                              8.16%
                                       12%
                                                       44%                          Pop. Annual Growth Rate ‘05-’15                                  0.79%

                                      12%                                           Area 1995 (Sq. Km)                                                7.01

                                                                                    Area 2005 (Sq. Km)                                               10.52
                                            20%
                                                                                    Area 2015 (Sq. Km)                                               13.16

                                                                                    Area Change '95-'05                                            50.08%
                                                                                    Area Change '05-'15                                            25.04%

                                                                                    Area Annual Growth Rate '95-'05                                  4.14%

                                Intra-city Area Composition                         Area Annual Growth Rate '05-'15                                  2.26%
                                                                                    Pop. Density 2005 (Per Sq. Km)                                  18,058

                100%                                                                Pop. Density 2015 (Per Sq. Km)                                  15,620
                                   7%
                  80%                                                               Density Change ‘05-’15                                         -13.50%
                                                             65%                    Land Consumption Index                                            3.07
                  60%              61%
                  40%

                                                                                          Percentage Change in Area Composition (2005-2015)
                  20%
                                   33%                       35%
                   0%
                                                                                                         Low Density    Medium Density  High Density
                                  2005                       2015
                                                                                                            Areas            Areas             Areas
                                              Chiniot

                  Low Density Areas   Medium Density Areas   High Density Areas          Chiniot             8%                7%               -100


                                                                                                                                                        66
   69   70   71   72   73   74   75   76   77   78   79