Page 119 - Final Atlas
P. 119

Punjab Cities Growth Atlas |  Section-4 - City Profiles
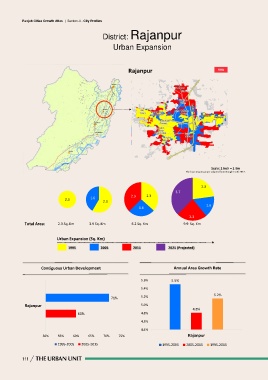

                                                                  District: Rajanpur


                                                                        Urban Expansion


                                                                                  Rajanpur                                                DHQ


                                                                                                                                      Scale: 1 Inch = 1 Km
                                                                                                                      The base map in grey is adapted from Google Earth 2017.


                                                                                                                               2.3
                                                                                                               3.7
                                                                                   2.3       2.3
                                                          1.6
                                          2.3
                                                                  2.3
                                                                                                                                   1.6
                                                                                        1.6

                                                                                                                        2.3

                 Total Area:         2.3 Sq. Km          3.9 Sq. Km                 6.2 Sq. Km                      9.9  Sq. Km


                                     Urban Expansion (Sq. Km)

                                            1995                2005                 2015                  2025 (Projected)


                           Contiguous Urban Development                                                       Annual Area Growth Rate


                                                                                          5.6%               5.5%

                                                                                          5.4%

                                                                                                                                       5.2%
                                                                       71%                5.2%

                 Rajanpur                                                                 5.0%
                                                                                                                          4.8%
                                                  60%                                     4.8%

                                                                                          4.6%

                                                                                          4.4%

                            50%      55%       60%       65%      70%       75%                                        Rajanpur

                                     1995-2005      2005-2015                                          1995-2005      2005-2015      1995-2015


               111
   114   115   116   117   118   119   120   121   122   123   124